Laura W. Dozal
PhD Candidate at the University of Arizona’s College of Information (iSchool). Computational Social Scientist with 6+ years of specialization in information behavior and visual analysis through Computer Vision, Natural Language Processings, Graph Science and knowledge discovery.
Download My Resume/CV
View My LinkedIn Profile
Data Science: Projects and Publications
Dissertation Research
Using Multimodal Sentiment Analysis for Knowledge Retrieval in Structured Graphs: Understanding Social Movement Messaging from a Collection of Topical Images
The use of computational methods on real world data to understand narrative messaging of social movements online as a way to monitor the social evolution of how a narrative can change over time, is seen across different mediums. The analysis models the communication messaging system of a social movement on a social media platform by building a narrative structure representative of the local semantics of image groups and an overall global summarization of the narrative structure as a whole.
- Data Collection: Createad a customized image and metadata collector script using Selenium, Beautiful Soup and Python packaged. Collected 19,000+ images and metadata from Instagram. Cleaned and processed data with an output of ~16,000 images and metadata in the collection of topical images.
- Data Annotation: Used Label Studio to annotate 3,020 images based on labels identified duing visual content analysis of the images.
- The first step pulls feature embedding from a collection of 16,657 Instagram images pertaining to the anti-feminicide movement in Mexico; and clusters them to identify common vector embeddings within the data. A Human-in-the-Loop (HITL) content analysis is applied to provide a qualitative understanding of the images within each cluster and to get insight on the classification aspects of the images for downstream tasks.
- The second step takes the images and runs them through foundational vision transformer models, along with generative Multimodal Large Language Models (M-LLMs) that generate two labels and a description of each of the images; and are compared and analyzed against each other using multi-label classification metrics along with HITL discourse analysis of the categorization process
- M-LLMs include: BLIP-2, Qwen 2.5VL, Llama3, Llama4 Scout, and phi4.
- The third step uses the top labels created from the model with the best overall quantitative and HITL discourse evaluation metrics to build multiple graphs representing the various stages of semantics found within the image and its attributes. The graph is analyzed to identify structural patterns of the network using traditional centrality measures and modularity models (Leidan algorithm) to understand the semantic connections within and across the network. The overall graph structure is compared to benchmark datasets in a Graph Attention Network (GAT) model that uses a variational autoencoder to compare classifications of the collected annotated image data.
These quantitative findings are used in conjunction with a theoretical analysis of how the media has framed the anti-feminicide movement in Mexico since the 1990’s, and implements a review of the network’s local and global semantics creating narrative structure for the collection of topical images.
Dissertation Workbench: Research pipeline in progress
AI/ML Workshop and Codebase for M-LLMOPS Pipeline (Funded by Jetstream Grant)
Advanced Natural Language Processing Projects
LLMs for summarization: First project covers using Llama3.2 and Tiny Llama from the Huggingface cli to summarize an academic paper in Natural Language Processing and/or Deep Learning. The Paper summarized is “Multilingual Image Corpus – Towards a Multimodal and Multilingual Dataset” - Svetla Koeva, Ivelina Stoyanova, Jordan Kralev (2022). Paper URL here.
Multimodal & Multilingual LLMs: The next project uses a multimodal & multiingual LLM to practice classifying images, text, and a combination of the two in a non-English language (Italian). The finetuned model used is BLIP-2, which was specifically created to provide an optimal text prompt, in different languages. With respect to this project, it helps identify the different clusters of images and image-caption pairs within a food dataset.
Author Profiling with Naive Bayes and Convolutional Nueral Networks: Based on the Wikipedia page, author profiling has various techniques that can be applied to predict information about the author, which in turn can help with identifying an author from text. Here I used Naive Bayes and Convolutional Neural Networks (CNN) as my main models to provide predictions.


Laboratory of Applied Sciences - Summer Conference of Applied Data Science (LAS-SCADS)
Video Object Detection Project
Implemented two video object tracking models: zero-shot transformers - OWL-VIT and LMM gpt-4o on noisy data- dashcam footage of a ride in Afghanistan provided by LAS staff. The goal was to explore improvements for tracking object obfuscation and detecting unknown/unconventional objects in the noisy surveillance video data. We found that pre-trained image models provided the most accurate structured data outputs. Go to Project Repository


A Comparison of Dynamic Chunk Size Methods (RAG Implememtation)
NLP researcher comparing chunk-size methods for text summarization. Used extractive summarization occams and abstractive summarization, Retrieval Augmentation Generation (RAG) to test different text segmentation methods. Used and created vector embedding database for evaluation using RAGAs, an LLM RAG evaluator. Used the 2024 TREC Challenge data-MSMarco docs and QA for analysis.


Bibliometric Data: Publishing Behavior of University of Rochester Researchers
This repository holds data and final analysis for the project, Bibliometric Data: Publishing Behavior of Rochester University Researchers. A project hosted by University of Rochester and backed by the LEADING Fellowship from Drexel University. The research question states where are University of Rochester researchers publishing/depositing data? The goal is to get a better understanding of how and where University of Rochester researchers are saving publishing their data. We attempted to analyze researcher publishing behavior and understand who is depositing data, where are they depositing it, how large are the datasets, and what formats are submitted/supported. The overall objectives were to find out where researchers are making their data publicly available. Identify common topics, relations, and overall trends. Using APIs, refine data collection techniques and conduct analyses on University of Rochester researcher data deposits into disciplinary data repositories.
Go to Project Repository
 Kewords per Repository Topic Kewords per Repository Topic |
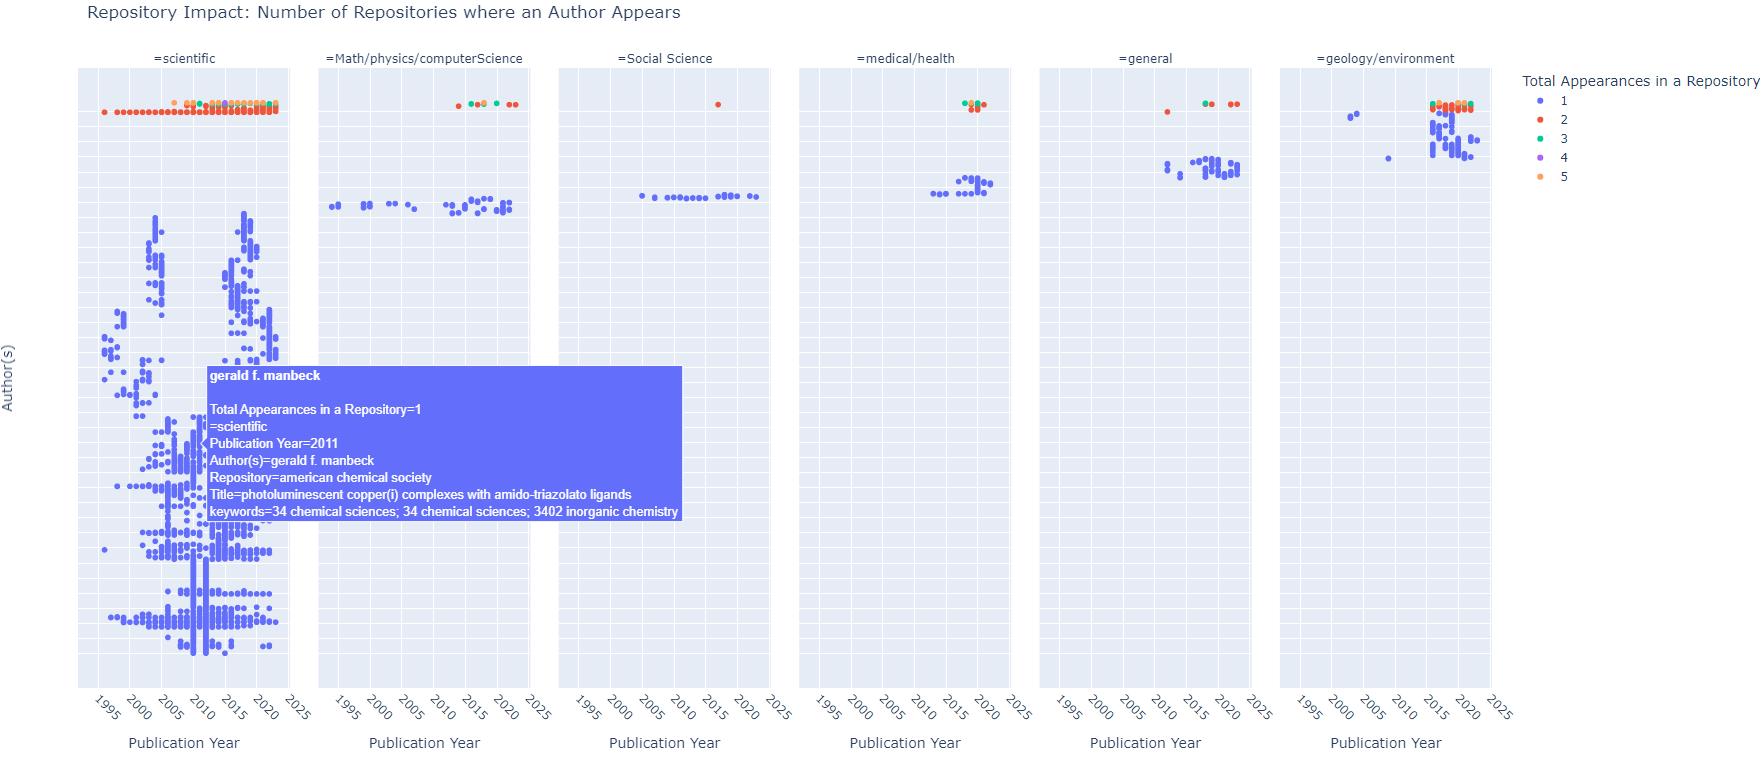 Authors Per Repository Topics Authors Per Repository Topics |
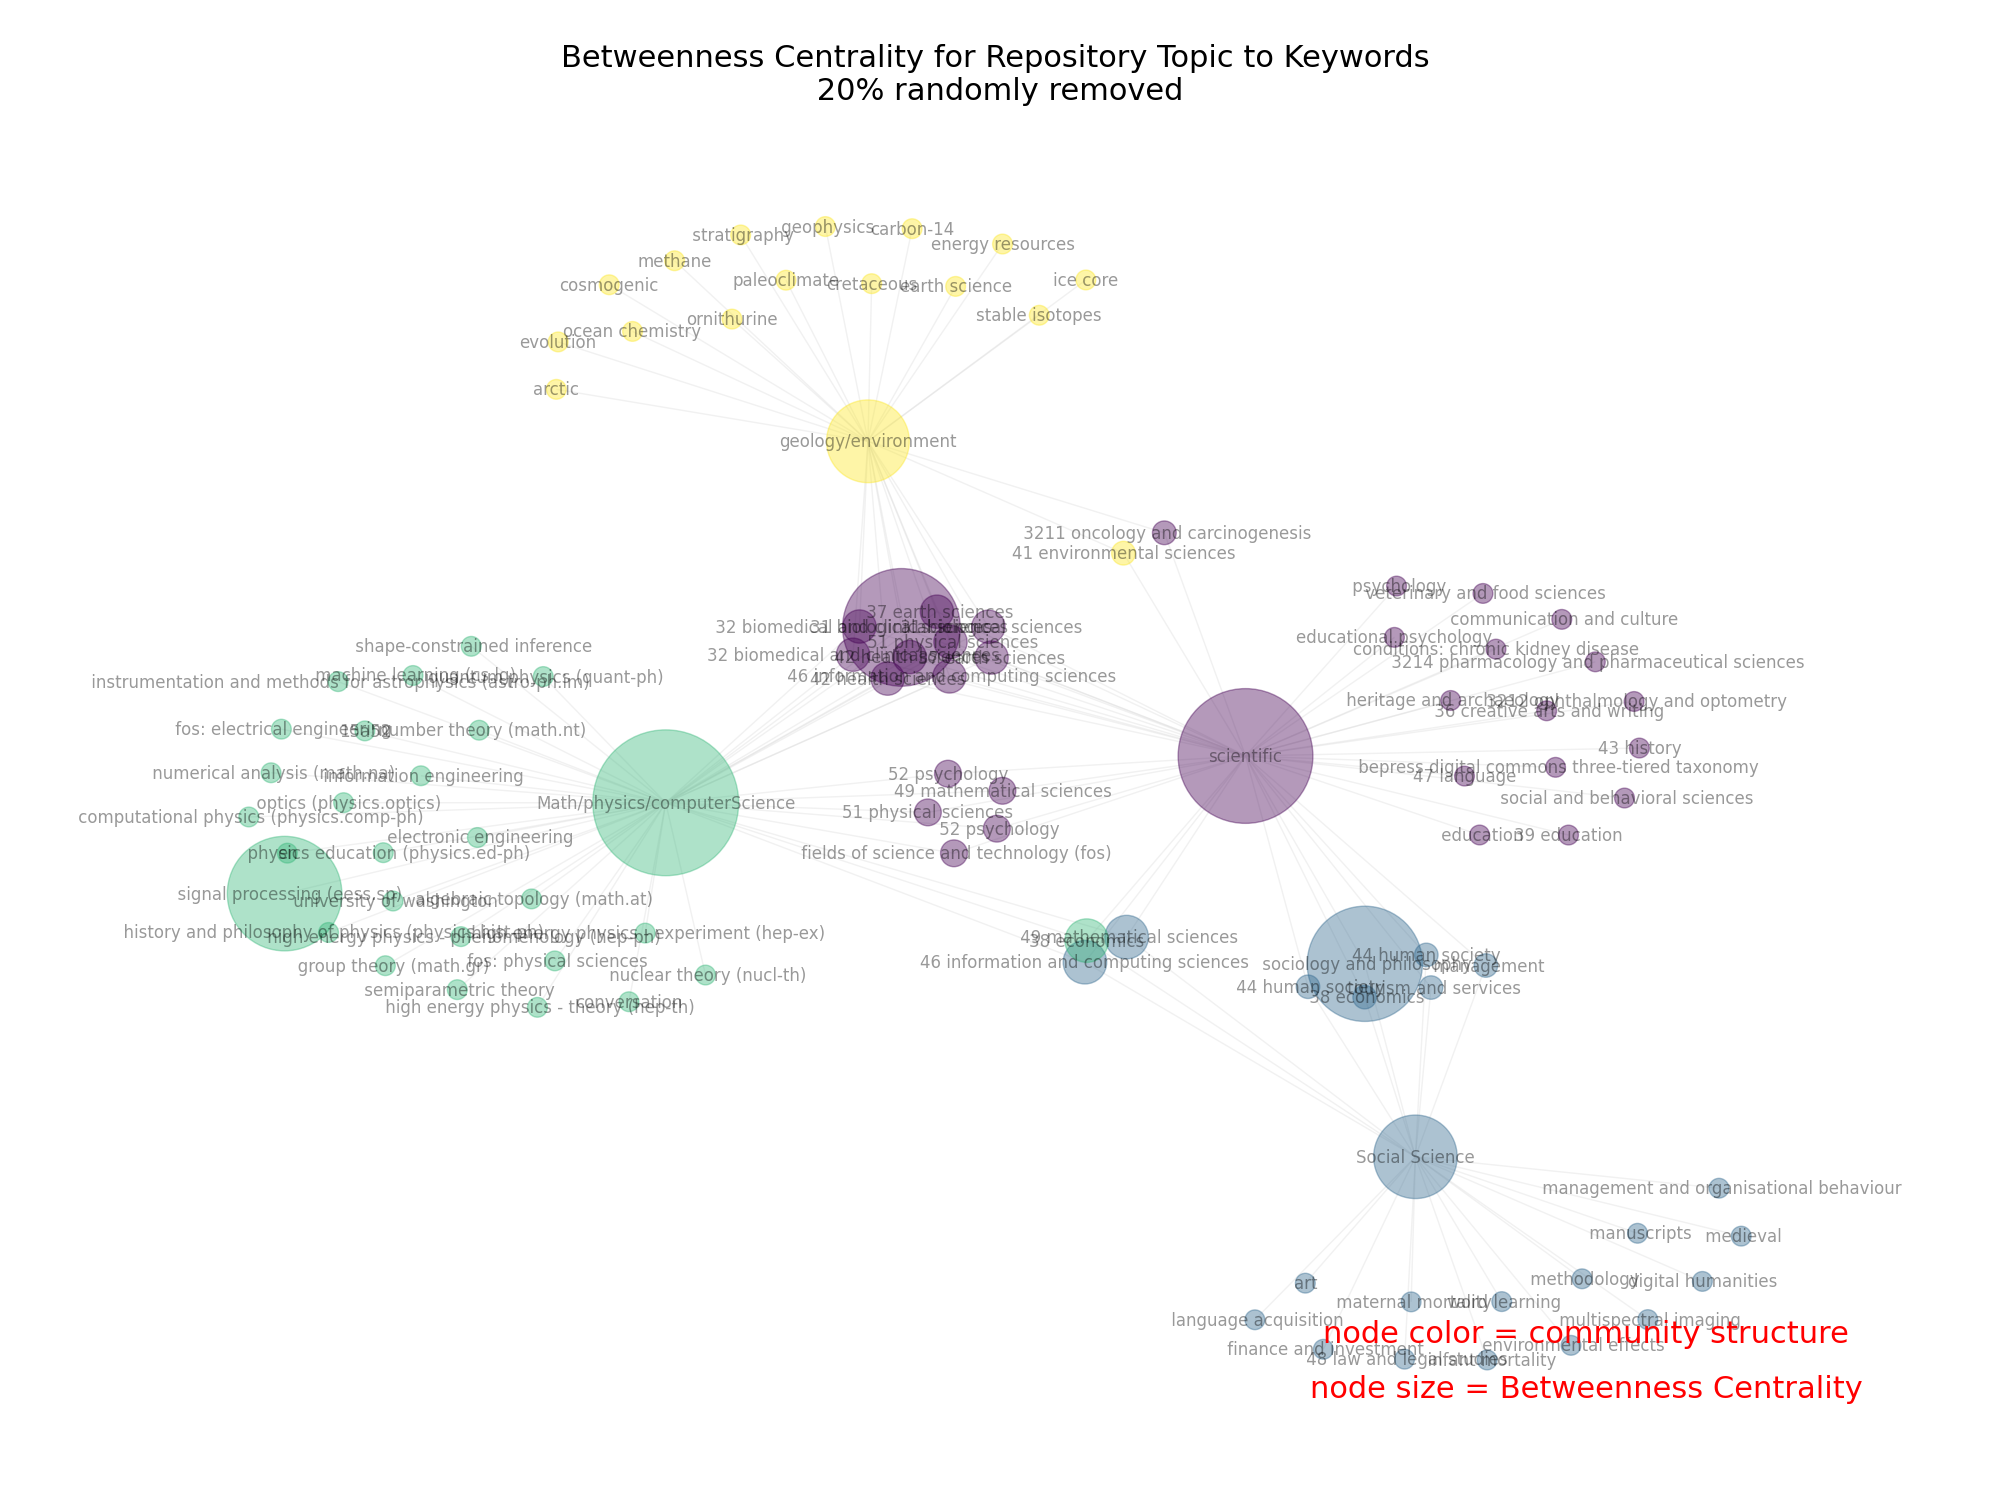 Keywords Betweeness Centrality Keywords Betweeness Centrality |
Street Art Network Analysis: Applications of Bi-Partite and Bi-Dynamic Line Graphs
In this analysis, Street Art images are considered as a type of visual information that can represent a specific perception of a community as a member of a community space. Dynamic By-partite network analysis was used to understand how different neighborhoods are connected through artist attributes and how they might differ. The results show that specific neighborhood traits, urban, population, culture contribute to stronger ties within the Street Art community network. Street Art as Visual Information: Mixed Methods Approach to Analyzing Community Spaces
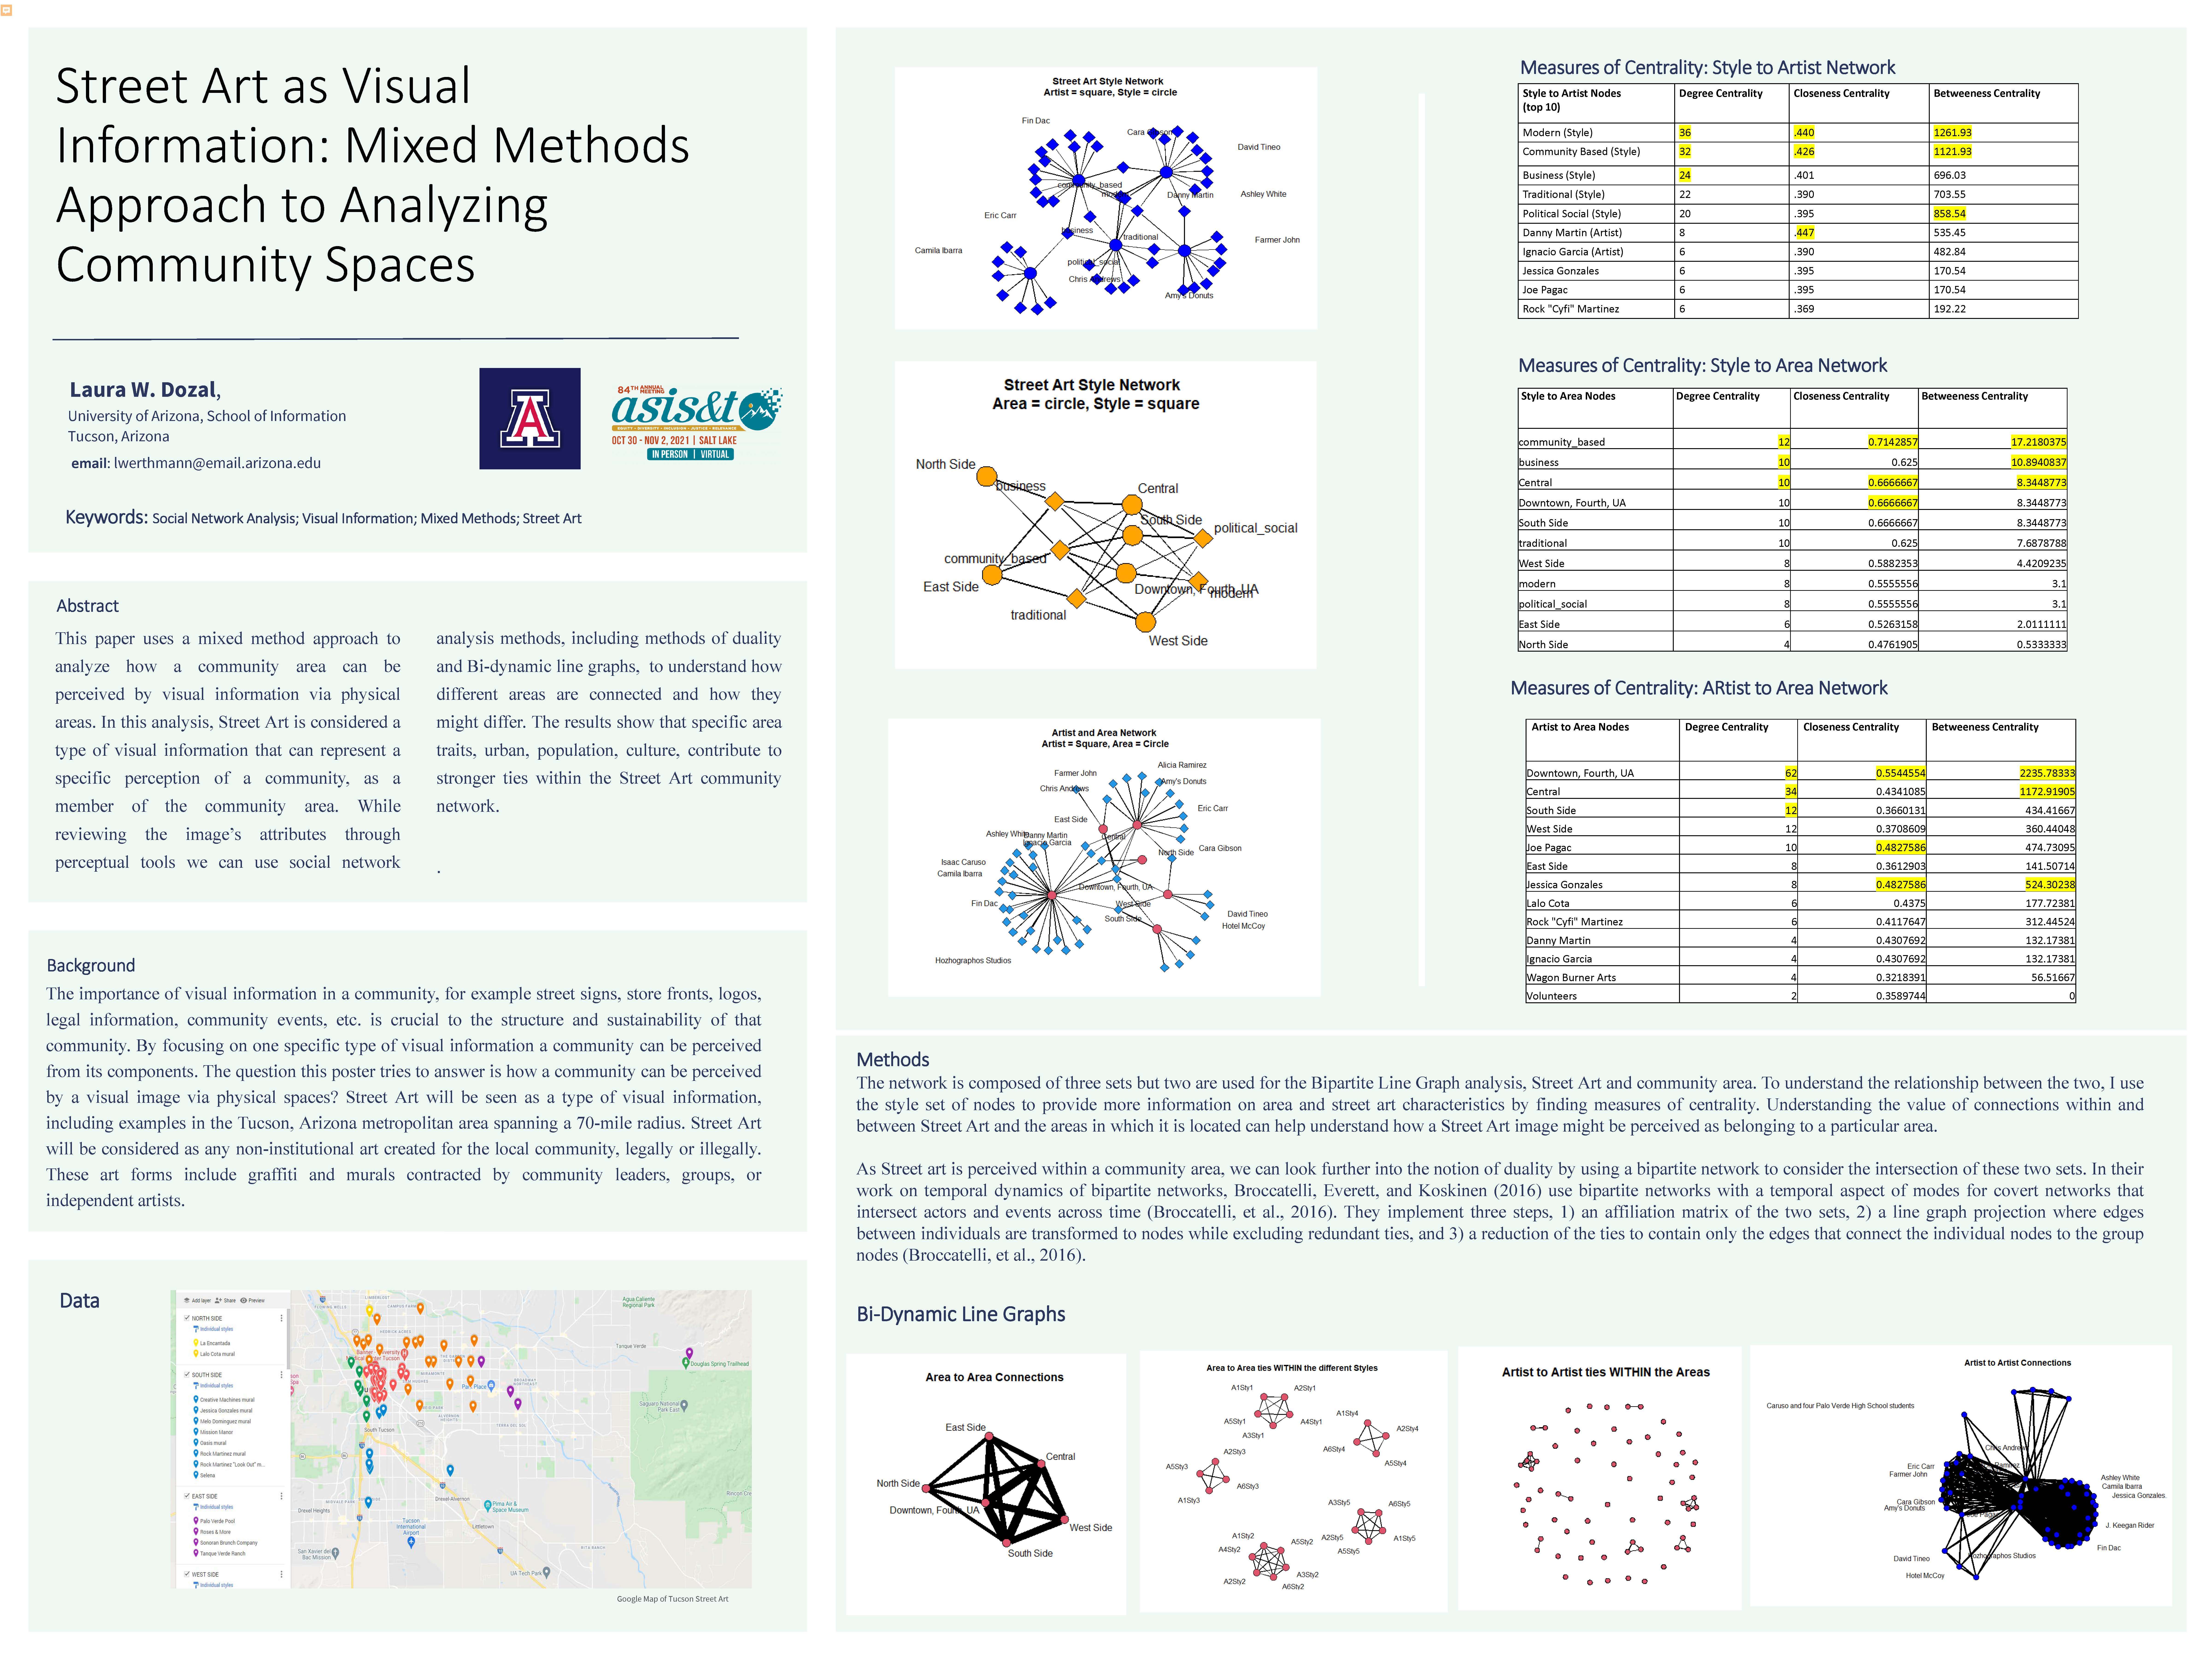
Github code: Tucson_Street-Art
Natural Language Processing: Model Comparison between BERT and Hierarchical Attention Networks
This project two natural language processing models on a dataset composed of labeled propaganda data. We reviewed off the shelf BERT and the Hierarchical Attention Network (HAN) models and found they both provide different accuracy levels, with BERT maintaining better results for the binary data classification problem. Identifying Propaganda: Comparing NLP Machine Learning Models on Propagandistic News Articles
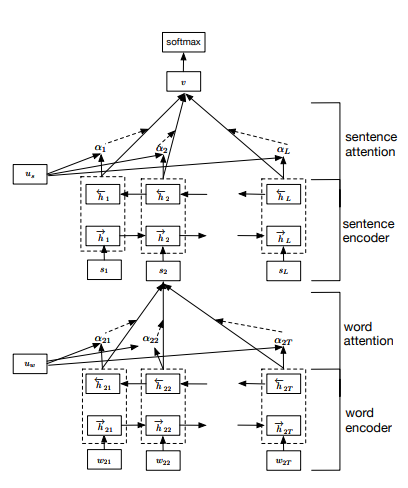 HAN Architecture HAN Architecture |
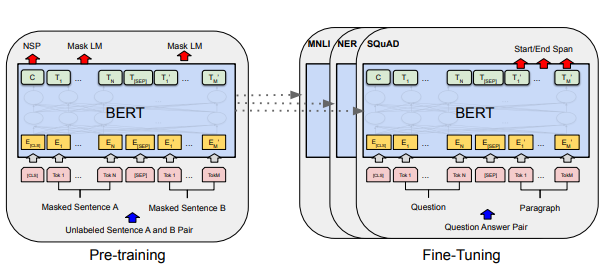 BERT pre-training and fine-tuning procedures BERT pre-training and fine-tuning procedures |
HAN Image taken from Yang et al 2016, BERT Image taken from Delvin et al. 2019
Github code: Identifying Propaganda
Mixed Method Framework for Understanding Visual Frames in Social Movements
This framework combines computational applications with visual methodologies to discover frames of meaning making in a large image collection. Frame analysis and Critical Visual Methodology (Rose, 2016) are reviewed and used in the framework to work in tangent with quantitative research methods. The methods framework is presented in the form of a matrix that enables researchers to identify applications for looking at social movements online through theoretical and computational approaches.
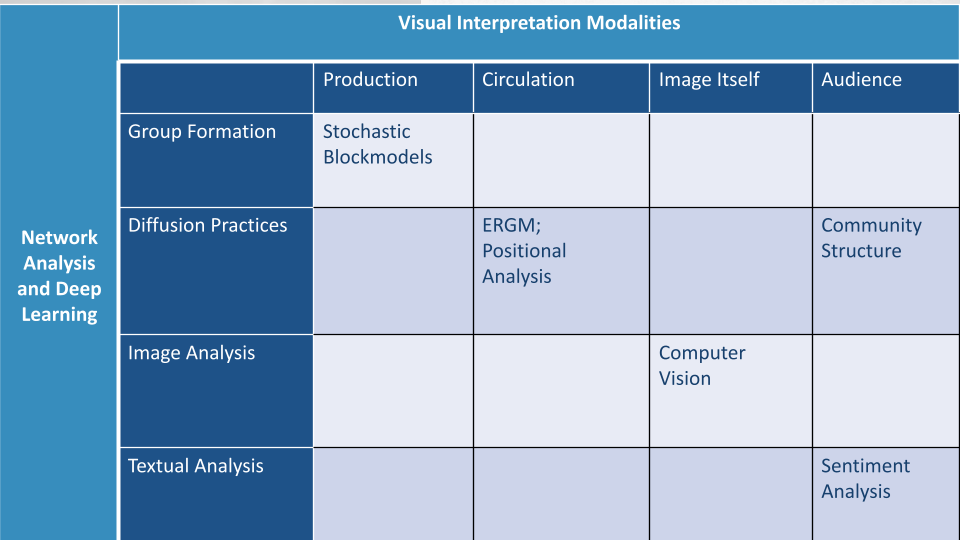 |
“Mixed Methods Framework for Understanding Visual Frames in Social Movements” - Long Paper Accepted to ASIS&T 2023
Theoretical Matrix Presented at Society for the Social Studies of Science Conference in 2022
Program can be found here
Data Science: Private Datasets and Code
Here I worked with private university data to tackle questions that support internal decision making. I used predictive modeling, statistics, Machine Learning, Data Mining, and other data analysis techniques to collect, explore, and extract insights from structured and unstructured data. Topics include revenue, retention/attrition, and student sentiment and experience.
Sentiment Analysis: Student Course Survey Comments
I analyzed 30K+ student course surveys using sentiment analysis packages in R to identify sentiment for all comments provided in student course surveys across campus. I also used SQL to pull the data from the Oracle database to be used for a personalized instructor dashboard.
Survival Analysis: University Retention and Attrition
I used survival and churn analysis to analyze the expected duration of attrition for female students and The University of Arizona. Here, Kaplan Mier and the supporting cox regression analysis were used to study retention. Churn analysis including methods of logistic regression, decision trees and random forests were used to study attrition. Read the report here
Internal Dashboard: Net Tuition Revenue
I developed an end-to-end production process of tuition and headcount dashboard visualizations and analysis using R and SQL. This consisted of aggregated data tables from an internal Oracle data warehouse that include descriptive statistics and inflation information of campus-wide Net Tuition Revenue (NTR).
Campus Climate Survey: Statistical Analysis and Inference
Applied statistical analysis and inference to surveys and collected data to review and test the University of Arizona’s Medical School’s performance for future accreditation. Types of data included survey data, raw archived data, collected government and academic data from large data systems. Used both R and Python to use analysis of variance, chi-square tests, post hoc and assumptions checks, regression analysis, correlation analysis, visualizations.


